PHM North America 2023 Conference Data Challenge
| Announcements! |
| Have a Question? Check out our Forum. |
Objective
This year’s data challenge addresses the problem of estimating gearbox degradation in a gearbox operated under a variety of conditions, and emphasizes metrics of trust, robustness and explainability. A measure of confidence for each submitted result is also required.
Problem
The task is to develop a fault severity estimate using the data provided. The training dataset includes measurements under varied operating conditions from a healthy state as well as six known fault levels. The testing and validation datasets contain data from eleven health levels. Data from some fault levels and operating conditions are excluded from the training datasets to mirror real-world conditions where data collection may only be available from a subset of full range of operation. The training data are collected from a range of different operating conditions under 15 different rotational speeds and 6 different torque levels. Test and validation data operating conditions span 18 different rotational speeds and 6 different torque levels. A model should generalize over previously unseen operational conditions and fault levels. Although this is a challenging task for data-driven models, it is a good representation of real-world PHM application. Participants are also required to express measures of confidence in model predictions. Such confidence measures might be used to determine whether these predictions can be trusted or not before taking any downstream actions.
All of these tasks (classification and prediction) require the model to provide a fault degradation level (label) as well as the corresponding confidence level. Participants will be able to submit model results for the testing data online and update as often as they want on a daily basis. All submissions will be scored daily at midnight Pacific Daylight Time (7:00 am UTC). Scores will be updated on a leaderboard to provide participants their relative positions.
During the validation phase of the challenge, a validation dataset will be released for a one-time assessment. The validation phase will be two weeks before the data challenge final deadline. Scoring of the last results file submitted by a team will be done only one time at the final deadline. Final submission links will be made available once the final data is released.
A few top performing teams from the validation phase will be selected for final evaluation. They will be asked to submit a brief report explaining their approach. Selection of winners will not only depend on the final validation set score but also the novelty and soundness of approach. Further, these teams will be required to agree to present their approach at the PHM 2023 conference before final winners are selected. Top winning approaches will be invited to submit a manuscript to the International Journal of Prognostics and Health Management (IJPHM) and present their approach and results at the 2023 PHM Society Conference. Winning teams will be announced and recognized at the conference banquet.
Teams
Teams may comprise one or more team members, and collaboration is highly encouraged. At least one member of the finalist teams must register and attend the PHM 2023 Conference to present their approach and results in the special data-challenge session. Finalists may also submit an extended abstract to be included in conference proceedings. A full manuscript maybe submitted to IJPHM for a journal publication after the conference.
The organizers of the competition reserve the right to both modify these rules or disqualify any team for efforts deemed inconsistent with fair and open practices.
Data Challenge Registration
Since the competition period has closed, registration is no longer required. Any logged-in user may upload submissions in the Data Challenge submission area.
To view the final scores at the end of the competition period, click here.
To view the ongoing scoring of results (updated daily), click here.
Relevant Dates
| Key PHM2023 Data Challenge Dates | |
Competition Open – the following information will be posted:
|
June 15, 2023 |
| Final Validation Data Posted | Aug 7, 2023 |
| Competition Closed | August 25,2023 (06:00:00 pm PDT) |
| Finalists Announced | August 28, 2023 |
| Conference Presentation Due | September 13, 2023 |
| Final Winners Announced | October 31, 2023 |
| PHM Conference Dates | October 28 – November 2, 2023 |
Datasets
Training and Testing Datasets
The training and test datasets are available here:
Validation Dataset
The validation dataset is now available for download here. See note in next section for submission process.
A list of references (see below) using the dataset is provided to help understand the data and provide some benchmark algorithms’ performance.
Data Challenge Submission
Please upload your submissions for both the testing and validation datasets in the Data Challenge submission area. Note that you will only see the submission area if you have previously applied using the application form and we have granted you access. You may upload or overwrite your submissions as often as you want. The system will automatically score the latest testing submission from each team every day at midnight Pacific Daylight Time (7:00 am UTC). Validation submissions will only be scored once (after competition closes). Results will automatically be posted on the Leader Board.
Please ensure the filename for testing dataset submissions is submission.csv and for validation dataset submissions is validation_submission.csv. Otherwise, the automated scorer will not read your file and score your algorithm, and the conference organizers will not consider your submission as a valid submission. Please ensure that your results are in the format shown in this example submission file.
Important Notes on Submission and Scoring Metric: There should be 13 columns in your submission. Column 1 is the sample number as marked in testing or validation dataset. Columns 2-12 are the estimated probability (0-1) for a given health state (0-10), where 0 is the healthy state and 10 is the most degraded state. The 11 health states are ordinal, i.e., each consecutive state has more degradation. While each health state can be ranked with a probability from 0 to 1, the sum of all health state probabilities must be less than or equal to 1. Thus, you are submitting a discrete probability distribution.
The final column represents your confidence in the discrete probability distribution, and it is a binary classification, where 0 and 1 mean low and high confidence resp. Please be aware that a high confidence level will be scored with a higher weight for the final sum of score, while a low confidence level will be scored with a lower weight. Similarly, a wrong prediction with a high confidence level will also be graded with a higher penalty. The exact rewards or penalty also depends on the how far the predicted label is from the underlying true label as specified in the following:
Where

The confidenceFactor is 0.2 and 1 for a reported confidence of 0 and 1 respectively. The healthStateScore is a point system based on proximity to the true answer, and summarized in the following table.
| Distance from true answer | Points |
| 0 (correct prediction) | 1.0 |
| 1 | 0 |
| 2 | -0.5 |
| 3 | -1.0 |
| 4 | -1.5 |
| 5 | -2.0 |
| 6 | -2.5 |
| 7 | -3.0 |
| 8 | -3.5 |
| 9 | -4.0 |
| 10 | -4.0 |
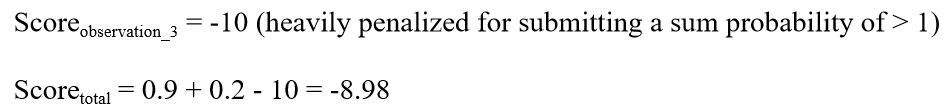
An example score for three observations is given:
| sample_id | true_state |
| 1 | 3 |
| 2 | 8 |
| 3 | 5 |
Consider an example submission
sample_id, prob_0, prob_1, prob_2, prob_3, prob_4, prob_5, prob_6, prob_7, prob_8, prob_9, prob_10, confidence
1,0,0,0.1,0.8,0.1,0,0,0,0,0,0,1
2,0,0,0,0,0,0.1,0.1,0.4,0.4,0.1,0.1,0
3,0.5,0.5,0.5,0.5,0.5,0.5,0.5,0.5,0.5,0.5,0.5,0
(Note that the last row is a bad entry since the sum of probabilities is > 1.)
To score this submission:
 The multiplying weight factors of 1 and 0.2 are corresponding to high confidence prediction and low confidence prediction, separately.
 Initial leaderboard will rank teams on aggregate score obtained as explained above. Top ranking teams towards the end of first phase will be selected as finalists. Final winners will be chosen after evaluating the overall approach and the presentation at the conference. Data challenge committee will form an evaluation panel of experts for this evaluation.
Relevant References
A .zip file of the following papers can be downloaded here.
- Jialin Li, Renxiang Chen, Xianzhen Huang, Yongzhi Qu, Development of Deep Residual Neural Networks for Gear Pitting Fault Diagnosis Using Bayesian Optimization, IEEE Transactions on Instrumentation & Measurement, 2022. https://doi.org/10.1109/TIM.2022.3219476
- Alex Nichifor, Yongzhi Qu. Koopman Operator Based Fault Diagnostic Methods for Mechanical Systems, Proceedings of International workshop on structural health monitoring (SHM) 2021, Stanford University, Palo Alto, CA, 2021
- Xueyi Li, Jialin Li, Chengying Zhao, Yongzhi Qu, David He, Gear pitting fault diagnosis with mixed operating conditions based on adaptive 1D separable convolution with residual connection, Mechanical Systems and Signal Processing, Vol. 142, Aug. 2020, https://doi.org/10.1016/j.ymssp.2020.106740
- Jialin Li, Xueyi Li, David He, Yongzhi Qu, Unsupervised rotating machinery fault diagnosis method based on integrated SAEDBN and a binary processor, Journal of Intelligent Manufacturing, 2020.
- Jialin Li, Xueyi Li, David He, Yongzhi Qu, A domain adaptation model for early gear pitting fault diagnosis based on deep transfer learning network, Journal of Risk and Reliability, Vol. 234, No. 1, pp. 168-182, 2020.
- Yongzhi Qu, Yue Zhang, Miao He, David He, Chen Jiao, and Zude Zhou, Gear pitting fault diagnosis using disentangled features from unsupervised deep learning, Journal of Risk and Reliability, Vol. 233, No. 5, pp. 719-730, 2019.
- Xueyi Li, Jialin Li, Yongzhi, Qu, David He, Gear Pitting Fault Diagnosis Using Integrated CNN and GRU Network with Both Vibration and Acoustic Emission Signals, 2019, Applied Sciences, Vol. 9, No. 4 (768).
- Jialin Li, Xueyi Li, David He, Yongzhi Qu, A Novel Method for Early Gear Pitting Fault Diagnosis Using Stacked SAE and GBRBM, 2019, Sensors, Vol. 19, No. 4 (758).
- Yongzhi Qu, Yue Zhang, David He, Miao He, Zude Zhou, A Regularized Deep Clustering Method for Fault Trend Analysis, Proceedings of the Annual Conference of the PHM Society, Vol. 11, No. 1, Scottsdale, AZ, USA, September 21-26, 2019.
- Xueyi Li, Zhendong Liu, Yongzhi Qu, and David He, Unsupervised Gear Fault Diagnosis Using Raw Vibration Signal Based on Deep Learning, IEEE Conference on Prognostics and System Health Monitoring, Chongqing, Oct. 26-28, Chongqing, 2018.
Problem Description
A brief problem description is provided for a quick reference. For more details please refer to list of papers provided under reference section.
The gear pitting experiments were performed on a one-stage gearbox installed in an electronically closed transmission test rig. The gearbox test rig includes two 45 kW Siemens servo motors. One of the motors can act as the driving motor while the other can be configured as the load motor. Motor 1 is the driving motor in this experiment. The overall gearbox test rig, excluding the control system, is shown in Fig. 1.
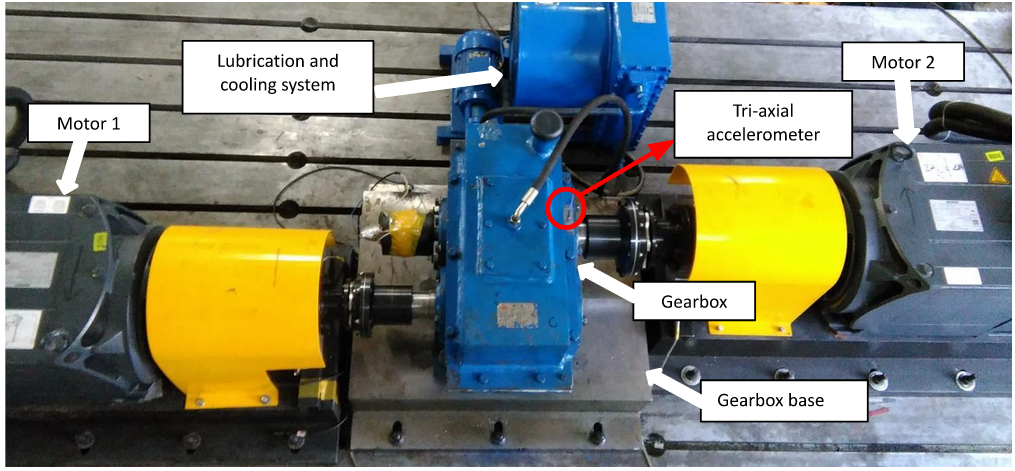 Figure 1. Experiment test rig for gearbox dynamic meshing stiffness analysis
The testing gearbox is a one stage gearbox with spur gears. The gearbox has a speed reduction rate of 1.8:1. The input driving gear has 40 teeth, and the driven gear has 72 teeth. The 3-D geometric model of the gear box is shown in Fig. 2. Detailed gear parameters are provided in Table 1.
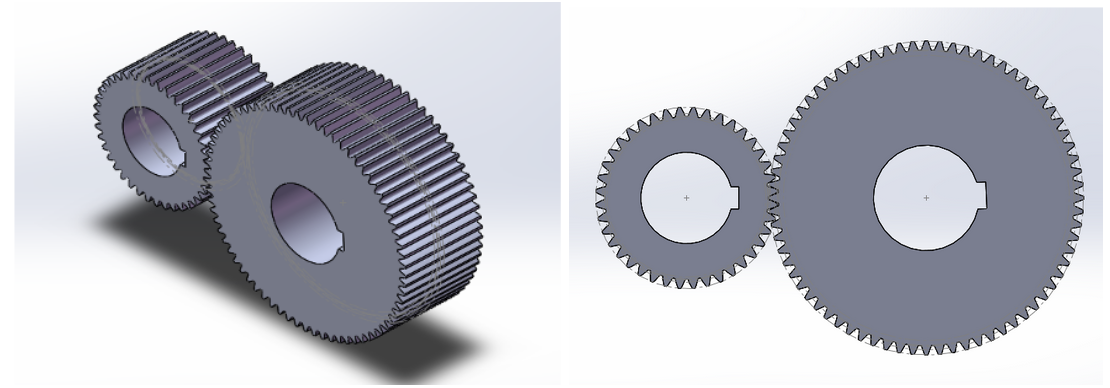
Figure 2. 3-D model of the gears under testing
Table 1. List of gear parameters for the tested gearbox
| Gear parameter | Driving gear | Driven gear |
| Tooth number | 40 | 72 |
| Module | 3 mm | 3 mm |
| Base circle diameter | 112.763 mm | 202.974 mm |
| Pitch diameter | 120 mm | 216 mm |
| Pressure angle | 20° | 20° |
| Addendum coefficient | 1 | 1 |
| Coefficient of top clearance | 0.25 | 0.25 |
| Diametral pitch | 8.4667 | 8.4667 |
| Engaged angle | 19.7828° | 19.7828° |
| Circular pitch | 9.42478 mm | 9.42478 mm |
| Addendum | 4.5 mm | 3.588 mm |
| Dedendum | 2.25 mm | 3.162 mm |
| Addendum modification coefficient | 0.5 | 0.196 |
| Addendum modification | 1.5 mm | 0.588 mm |
| Fillet radius | 0.9 mm | 0.9 mm |
| Tooth thickness | 5.8043 mm | 5.1404 mm |
| Tooth width | 85 mm | 85 mm |
| Theoretical center distance | 168 mm | 168 mm |
| Actual center distance | 170.002 mm | 170.002 mm |
A tri-axial accelerometer was attached on the gearbox case close to the bearing house on the output end as shown in Figure 3. X, Y, Z are horizontal, axial and vertical, separately.
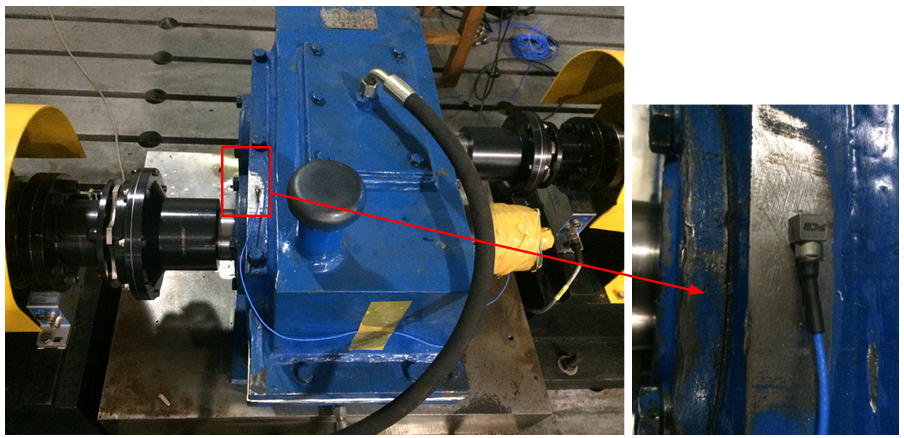 Figure 3. Vibration measurement with Tri-axial accelerometer
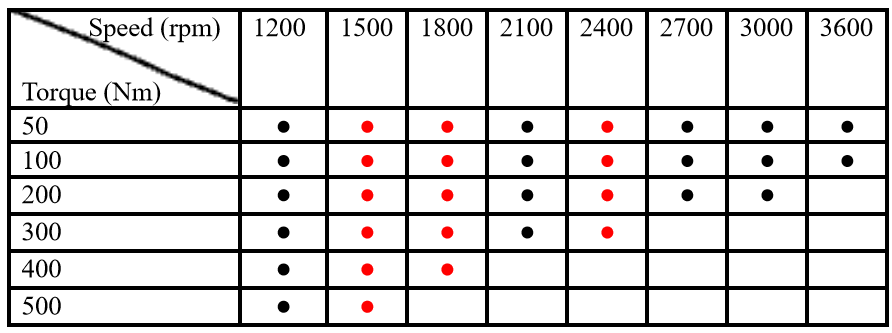
Both healthy and gradually pitted gear under various operating conditions were tested and the vibration signals collected. Each .txt data file is named with the corresponding rpm and torque values. V100_200N_2.txt means rotational speed of 100 rpm of the input shaft with a 200 Nm torque on the output shaft. ‘_2’ represents the second repetition of the data collection. For all operation conditions, 5 sets of data were collected. Black dots indicate that the data are provided for training while RED dots indicate the data are hidden from training but will appear in testing and validation.
Table 2. Operation conditions of the experiments (low speed)
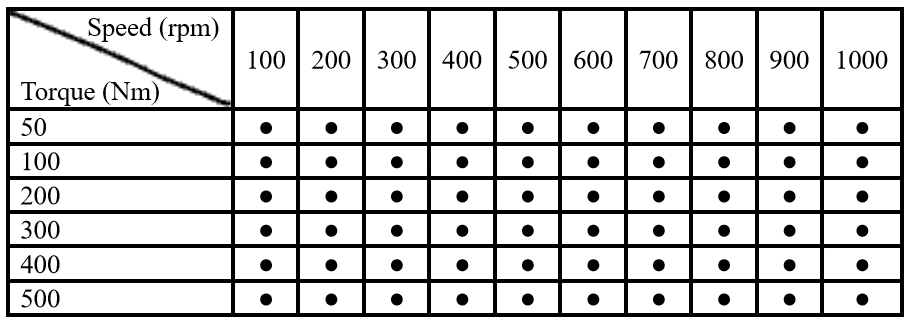
Table 3. Operation conditions of the experiments (median to high speed)
One or more gear teeth are manually degraded using a drill bit through the lube oil cover without any disassembly and assembly of the gearbox or test rig. From 0 to 10, each level up is more degradation. Data from each degradation level is saved to a separate data folder.
Out of all data marked as black (78 operating conditions throughout 7 health levels), on average, 3.69 repetitions for each operating condition of each fault level are included in the training data set. A total of 2016 data files are included in the training. Pitting degradation levels 5, 7, 9, 10 are omitted from the training data set.
Sampling rate and sampling time description:
To sample enough data points in terms of revolutions, longer time series data are collected for lower rotational speed conditions. More specifically, for 100-200 rpm, the sampling time is about 12s; for 300-1000 rpm, the sampling time is about 6s; for 1200 rpm and above, the sampling time is about 3s.
Vibration signal sampling rate: 20480 Hz.
Columns of vibration data, from left to right are horizontal, axial, and vertical accelerations separately, and tachometer signals in the last column. All signals are time synchronized.
The tachometer (laser reflective tachometer) outputs one pulse per revolution. This is measured on the output shaft, which is 5/9 of the input shaft speed. For example, for data files named ‘V2100_200N_2.txt’, the input shaft speed is 35Hz and output shaft speed 19.44 Hz. Tachometer signal measures an average speed of 19.46 Hz.