2019 PHM Conference Data Challenge
- Introduction
- System Description
- Data Format
- Penalty Score
- Downloads
- Final Submissions
2019 PHM Conference Data Challenge – Team Results Now Available!
2019 PHM Conference Data Challenge – Submission Page
Objective
In this data challenge, participants are being asked to provide estimates for crack length at different points the life of an aluminum structure that is subject to dynamic tensile loading conditions. Wave signals data from piezo sensors (as well as loading conditions) were collected for a number of aluminum lap joint specimen that are made available for analysis. Ground truth data (actual crack length) is available for the test data sets. Participants are then asked to provide estimates for several validation data sets. The validation sets consist of only the sensor data and future load conditions.
Both model-based as well as data-driven approaches are being encouraged. The validation data are being released in stages. That is, participants will have to submit their estimate for a particular time before data for the next load condition is being released. This process is automated.
The following details are available via the tabs to the left:
- Details: Description of the test setup
- Data Format: Overview of the format of the data files
- Penalty Score: The scoring function used to evaluate submissions
- Downloads: Training data is available to download now for teams who are logged in. A validation data set will be made available starting July 14th
The top three teams will be asked to submit their approach as a paper to the PHM Conference and are expected to present their approach at the conference. Top teams are also being recognized at the banquet and will receive a plaque. In addition, all teams have the option to submit a poster via the conference submission website (www.phmpapers.org) to be presented at the conference.
Teams
Collaboration is encouraged and teams may be comprised of one or more students and professionals. The teams judged to have the first, second, and third best scores will be awarded prizes of $600, $400, and $200, respectively, contingent upon:
- Having at least one member of the team register and attend the PHM 2019 Conference.
- Submitting a peer-reviewed conference paper. Submission of the data challenge special session papers is outside the regular paper submission process and follows its own modified schedule.
- Presenting the analysis results and technique employed at a special session within the Conference program.
The organizers of the competition reserve the right to both modify these rules and disqualify any team for any efforts it deems inconsistent with fair and open practices. In addition, the top entries will also be encouraged to submit a journal-quality paper to the International Journal of Prognostics and Health Management (ijPHM).
Data Challenge Registration
Teams may register here. Please note: In the spirit of fair competition, we allow only one account per team. Please do not register multiple times under different user names, under fictitious names, or using anonymous accounts. Competition organizers reserve the right to delete multiple entries from the same person (or team) and/or to disqualify those who are trying to “game” the system or using fictitious identities.
Relevant Dates
| Key PHM Data Challenge Dates | |
Competition Open – the following information will be posted:
|
April 29, 2019 |
| Final Validation Data Posted and Result Submission Website Open | July 14, 2019 |
| Competition Closed | July 31, 2019 (11:59:59 pm PDT) |
| Preliminary Winners Announced | August 4, 2019 |
| Winners Announced | August 18, 2019 |
| Final Papers Due, Winners Announced | August 25, 2019 |
| PHM Conference Dates | September 23-26, 2019 |
This data set consists of measurement from piezeoelectric (PZT) sensors that are mounted on aluminum specimen that were tested to fatigue conditions. Fatigue cracks developed in the specimen and failure was declared at a particular crack length. A schematic illustration of the sensing mechanism is shown in Fig. 1 (an actuator and a receiver form a sensing pair). The actuator sends out a wave which is measured by the receiver. The distance between the actuator and receiver is 161 mm. If a crack has formed along the wave propagation path, the received signal will change, which can be used for diagnosis and prognosis purposes. During testing, measurements are acquired two times for each measurement point. Details on the experimental testing description and data organization is given below.
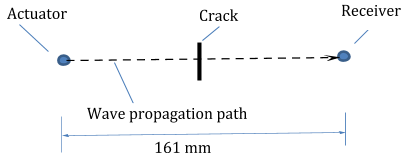
Fig. 1. Schematic illustration of crack sensing mechanism
Eight specimens (named T1 through T8) were investigated (specimen T1-T6 are to be used for training and T7-T8 are to be used for validation). A hydraulic material testing machine working at 5Hz at room temperature conducted the fatigue testing. Both constant amplitude loading and variable amplitude loading cases were studied. T1-T7 were under constant amplitude fatigue loading and T8 was under variable amplitude loading. During testing, an optical microscope was used intermittently to identify the location of crack appearance and top measure crack length. While a multitude of sensors were deployed, here only sensor pairs that bracket a crack are listed (see Table 1).
| Table 1. Riveted lap joints fatigue testing results summary | ||
| Specimen NO. | Crack initiation location | Loading Spectrum |
| T1 | Sensor pair 6-1 | Constant |
| T2 | Sensor pair 9-4 | Constant |
| T3 | Sensor pair 8-3 | Constant |
| T4 | Sensor pair 9-4 | Constant |
| T5 | Sensor pair 10-5 | Constant |
| T6 | Sensor pair 6-1 | Constant |
| T7 | Sensor pair 9-4 | Constant |
| T8 | Sensor pair 6-1 | variable |
The objective of this data challenge is to predict the crack lengths of lap joint.
Model training: 6 specimens (T1-T6) are to be used as training datasets, in which all data include ultrasonic data at corresponding number of cycles, true crack length measurements at corresponding number of cycles, and loading profiles.
Model validation: 2 specimens (T7 and T8) are to be used as validation datasets, in which ultrasonic data at corresponding number of cycles and loading profiles are provided.
Performance evaluation: Participants are expected to generate predicted crack length as summarized in the following table. The predicted crack length is the final outcomes for all competing teams. Crack length estimates are expected to be submitted one data point at a time (say for T7 at cycle 40000) so that the next cycle number is being released.
An error function will evaluate the performance of the predictions. Details of the error function are provided on the “Penalty Score” tab. In addition, a spreadsheet with the calculations has been provided in the “Downloads” tab (for logged-in contestants).
Training data set organization
All training data set for specimens T1-T6 are organized in the folder of “training” using 6 sub-folders. Within each sub-folder corresponding to a specimen, there is a specimen-specific description excel file (for example, “Description_T1”) corresponding to that particular specimen. The crack propagation details and loading spectrum for that particular specimen is listed in that excel file. For example, in the case of T1, an example of the observed crack lengths as shown in Table. 2 (as shown in the file “Description_T1”).
Table 2. Specimen T1 fatigue testing data
| Number of cycle | Crack length (mm) |
| 50000 | 0 |
| 60000 | 2.18 |
| 62500 | 2.76 |
| 65500 | 3.51 |
| 69025 | 4.51 |
| 70026 | 4.9 |
| 70766 | 7.46 |
The loading profiles is also included in the folder for each specimen. The file name is “Constant Loading Profile-5 cycles.csv”. Since all specimens in the training data set have the same loading profile, the file is the same for specimen T1-T6. Time history for the applied force for the first 5 cycles are reported in the file. The first column is the time and the second column is the stress value (unit: MPa).
Piezosensor signals are reported in the sub-folder within each specimen folder and is organized corresponding to the measurement time (i.e., number of cycles). Within each folder, there are two files “signal_1” and “signal_2”, which corresponds to two repetitions for the same measurement. Each data file contains three variables “time”, “ch1”, and “ch2”. While the first is self-explanatory, “ch1” and “ch2” correspond to the actuation signal and received signal, both of which are measured in Volts.
The total number of data-files available for each specimen at each cycle-number is tabulated in Table 2.
Table 3. List of Data-Files
| Specimen | Cycle Number | Number of Data-Files (including repetitions) |
| T1 | 50000 | 2 |
| 60000 | 2 | |
| 62500 | 2 | |
| 65500 | 2 | |
| 69025 | 2 | |
| 70026 | 2 | |
| 70766 | 2 | |
| T2 | 50000 | 2 |
| 70033 | 2 | |
| 72000 | 2 | |
| T3 | 14000 | 2 |
| 50000 | 2 | |
| 55391 | 2 | |
| 57038 | 2 | |
| 60035 | 2 | |
| 62017 | 2 | |
| 64019 | 2 | |
| 65029 | 2 | |
| 66012 | 2 | |
| 66510 | 2 | |
| T4 | 55900 | 2 |
| 60200 | 2 | |
| 65001 | 2 | |
| 67054 | 2 | |
| 70016 | 2 | |
| 71130 | 2 | |
| 73210 | 2 | |
| 75045 | 2 | |
| T5 | 42000 | 2 |
| 46000 | 2 | |
| 51000 | 2 | |
| 56000 | 2 | |
| T6 | 40000 | 2 |
| 50000 | 2 | |
| 70000 | 2 | |
| 73000 | 2 | |
| 77000 | 2 | |
| 79000 | 2 | |
| 82000 | 2 | |
| 85000 | 2 | |
| 88000 | 2 | |
| 91000 | 2 | |
| 93000 | 2 |
Validation data set organization
Experimental data for specimens T7 and T8 is contained in the validation folder. The setup for validation data mimics the situation in practice, in which the true crack length measurements are not available and only sensor signal is available for inference of the crack length. In addition, only signal from the first few numbers of cycles are available and the prediction for future crack length is required to carry out prognostics. Thus, the validation data set has some differences compared to the training data set.
Under the folder of specimens T7 and T8 in the validation data set, the description file (e.g., “Description_T7”) does not contain any ground truth value of the crack lengths. The crack lengths need to be predicted.
Another difference is the loading file for specimen T8, which is variable amplitude loading. The file name is “Variable Loading Profile-1 block-1000 cycles” and contains a block of loading for 1000 cycles. The load will repeat this pattern for the entire dataset.
Variables:

Clarification: In the above variables, “crack length” is the “% of full crack length at failure” for penalty score calculations. We recognize that you will not know the full crack length when submitting your final results, so please be prepared to submit crack lengths in millimeters (we will perform the normalization for scoring on the back end using the known full crack length).
Time penalty function:
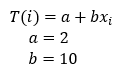
This penalizes prediction error at the end of life more than that at the initial stages of crack growth.
Asymmetric penalty function:
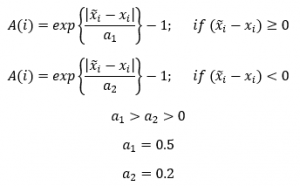
This penalizes underestimation of crack length more than overestimation, since the prior has more dire consequences.
Monotonicity penalty function:

This penalizes cases when estimated crack length doesn’t follow a monotonic trend. Data-driven methods may sometimes lead to such results but that doesn’t follow the physics of crack growth problem. Hence these cases need to be penalized.
Overall Penalty Score:
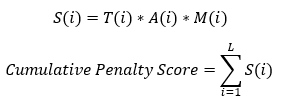
The range of this score is [0, ∞). Perfect penalty score is 0 when prediction matches ground truth.
A spreadsheet incorporating these calculations is provided in the Downloads tab for the validation dataset.
Training data
While the competition is ongoing, Teams will be required to register and be logged in to download the training data.
Please see the forum post (here) or copy & paste the following for explanation of the update to the training and the impact to the competition.
https://www.data-phmsociety.org/forums/topic/question-on-validation-data/
PHM2019 Crack Growth Training Data (Updated 18 Jul 2019) 983 KB
Download Crack
PHM2019 Scoring Spreadsheet 22.46 KB
Download Scoring
Validation data
Validation data and submission information is available here:
2019 PHM Conference Data Challenge – Submission Page
https://data.phmsociety.org/2019datachallengesubmission