PHM North America 2025 Conference Data Challenge
Problem Domain
Engine Health Management for aircraft engines includes assessment of the health of gas-path components as well as externals such as controls and accessories. Dedicated diagnostic sensors are used for monitoring structural health using vibration sensors as well as fuel and oil/lube systems.
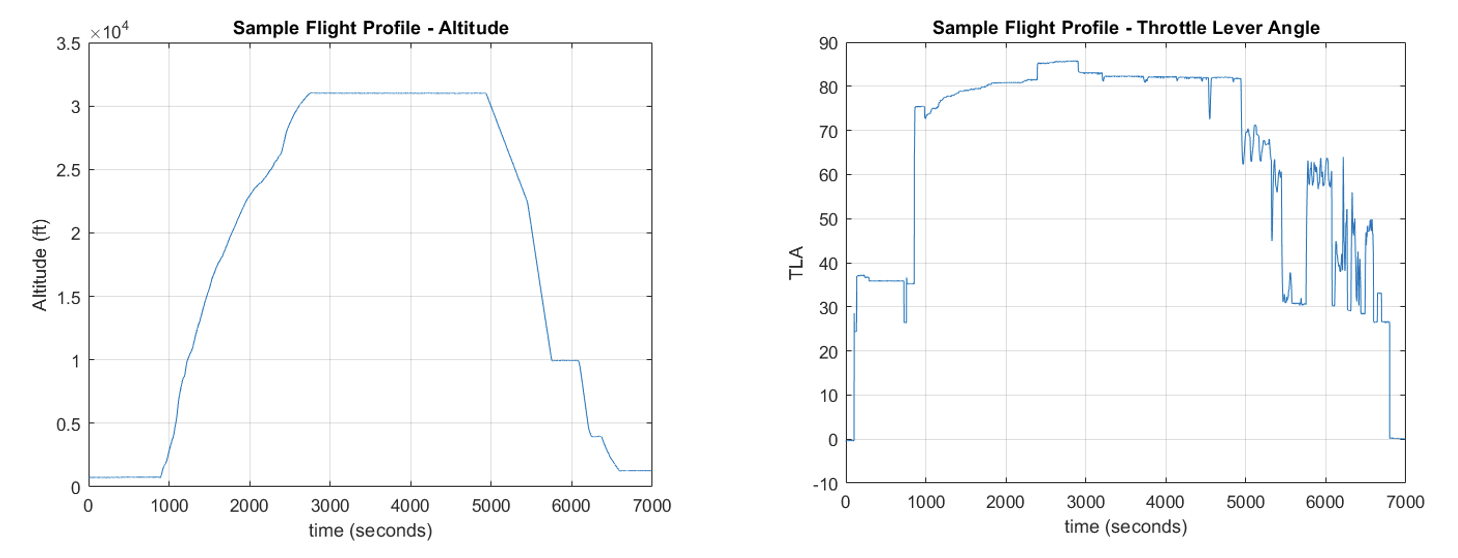
An engine will undergo several ‘cycles’ of changes in speed and temperature from low values at idle to high values at takeoff. Cyclic stresses cause engine components to deteriorate. Typically, each aircraft flight is counted as one engine cycle. An aircraft flight between a pair of cities will consist of ground idle, taxi out, takeoff, climb, cruise, descent, approach and landing, and taxi back. A sample flight profile from the DASHlink database (reference [1], Tail_687_1, 687200104141245.mat ) is shown in the Figure below.
This challenge problem limits itself to the use of aircraft sensors and gas-path sensors to estimate the time (cycles) remaining for periodic maintenance activities such as water wash and long term servicing of key components – the High Pressure Compressor and the High Pressure Turbine.
Objective
The 2025 EHM Data Challenge focuses on predicting key maintenance events for commercial jet engines using typically available sensor data. Participants must build models to estimate remaining cycles to three key events:
- High Pressure Turbine (HPT) Shop Visit
- High Pressure Compressor (HPC) Shop Visit
- HPC Water-Wash
Participants are expected to split the dataset into training, validation, and test sets, develop predictive models, and submit results in format consistent with the guidelines provided in this document.
Problem
Participants are given metadata and sensor data for eight commercial jet engines (ESN101 to ESN108), each with up to 15,000 data points across 2001 flights. As typical of commercial aviation industry, data includes up to eight snapshots per flight from different flight phases (e.g., Takeoff, Climb, Cruise). Snapshots are recorded states of a set of sensors at pretermined flight conditions.
You must predict:
Cycles_to_HPT_SV– Cycles to Shop Visit for the High Pressure Turbine (HPT) (typically <= ~6000 cycles )Cycles_to_HPC_SV– Cycles to Shop Visit for the High Pressure Compressor (HPC) (typically <= ~12500 cycles)Cycles_to_WW– Cycles to HPC Water-Wash (typically <= ~1250 cycles)
Sensor data from up to 14 available variables can be used (the last two sensors are generally optional and may or may not be available in all Test datasets). Participants are encouraged to avoid ‘peeking into the future’ i.e. using metadata that reflects post-event states when building their models. In other words, any prediction p(t) made at a time t should only use inputs available until that time, i.e. time <= t.
Datasets
The datasets includes:
- Meta Data (Columns A-F): Engine serial number, cycles, snapshot number, cumulative maintenance counts
- Sensor Data (Columns G-W): 16 sensed engine variables (14 primary)
- Targets (Columns W-Y): Remaining cycles to three maintenance events
Data preprocessing and normalization are recommended. Participants must define their own train/validate/test splits
The training and test datasets are available here:
Final validation data will be posted toward the end of the competition. Winners will be judged solely on their scores on the validation data. Finalists will be invited to submit a report and present at the PHM 2025 Conference. Finalists must attend and present their approach at the conference to be eligible for prizes.
Example Submission Format
Participants will submit predictions as a CSV file with:
fileCycles_to_HPT_SVCycles_to_HPC_SVCycles_to_WW
An example submission file can be downloaded here.
Scoring
Prediction accuracy is the primary metric however, scores will be aggregated with two levels of asymmetry.
- Penalties for making “late predictions” are higher than “early predictions” for all three predicted variables.
- Penalties are also higher if an error is made closer to actual event time than when prediction horizon is larger when measured from the actual event ground truth.
Exact scoring functions are give below.
def time_weighted_error(y_true, y_pred, alpha=0.02, beta=1):
  """Returns the weighted squared error for an array of predictions."""

  error = y_pred-y_true

  weight = np.where(
  error >= 0,
  2 / (1 + alpha * y_true),
  1 / (1 + alpha * y_true)
  )
  return weight * (error ** 2)*beta

def score_submitted_result(df_true, df_pred):
  '''Calculate the score for a single team's submission'''

  # Extract the targets
  true_WW = df_true.Cycles_to_WW.values
  true_HPC = df_true.Cycles_to_HPC_SV.values
  true_HPT = df_true.Cycles_to_HPT_SV.values

  pred_WW = df_pred.Cycles_to_WW.values
  pred_HPC = df_pred.Cycles_to_HPC_SV.values
  pred_HPT = df_pred.Cycles_to_HPT_SV.values

  # WW score
  alpha = 0.01
  beta = 1/float(max(true_WW))
  score_WW = time_weighted_error(true_WW, pred_WW, alpha, beta)
  # Take the mean of the array
  score_WW = np.mean(score_WW)

  # HPC score
  alpha = 0.01
  beta = 2/float(max(true_HPC))
  score_HPC = time_weighted_error(true_HPC, pred_HPC, alpha, beta)
  # Take the mean of the array
  score_HPC = np.mean(score_HPC)

  # HTC score
  alpha = 0.01
  beta = 2/float(max(true_HPT))
  score_HPT = time_weighted_error(true_HPT, pred_HPT, alpha, beta)
  # Take the mean of the array
  score_HPT = np.mean(score_HPT)

  # Average score
  score = np.mean([score_WW, score_HPC, score_HPT])

  return score
Timeline
| Date | Stage |
|---|---|
| July 1st, 2025 | Competition Opens |
| August 22nd, 2025 | Final Test data posted |
| September 5th, 2025 (11:59:59 pm PDT) | Competition Closes |
| September 9th, 2025 | Finalists Announced |
| October 1st, 2025 | Conference Presentation Slides Due |
| October 27-30, 2025 | PHM Conference |
| October 28th, 2025 | Final Winners Announced |
Submission Portal
Please upload your submissions for both the testing and validation datasets in the PHM Challenge Submission Portal (coming soon!). Note that you will only see the submission area if you have previously applied using the application form and we have granted you access. You may upload or overwrite your submissions as often as you want. The system will automatically score the latest testing submission from each team every day at 3:00 am Pacific Daylight Time (10:00 am UTC). Validation submissions will only be scored once (after competition closes). Results will automatically be posted on the Leader Board (coming soon!).
Please ensure the submission file uses the CSV format. Thus, the filename for testing dataset submissions is submission.csv and for validation dataset submissions is validation_submission.csv. Otherwise, the automated scorer will not read your file and score your algorithm, and the conference organizers will not consider your submission as a valid submission. Please ensure that your results are in the format shown in this example submission file.
Eligibility & Teams
Teams of one or more individuals are eligible. At least one member of each finalist team must attend the PHM 2025 Conference. Reports and presentations are required for award consideration.
Tools and References
Participants may use any modeling tools or frameworks. Reference code and guidance may be provided during the competition period. For further background, refer to:
- NASA DASHlink – (https://c3.ndc.nasa.gov/dashlink/projects/85/).
- NASA AGTF30 Simulation – MATLAB Executable Steady-State Solver and Linearization Tool for the AGTF30 Engine Simulation (MEXLIN-AGTF30), https://software.nasa.gov/software/LEW-20688-1. See also https://software.nasa.gov/software/LEW-19717-1.
- MATLAB T-MATS Toolbox – https://ntrs.nasa.gov/api/citations/20180002976/downloads/20180002976.pdf.
For questions or support, please reach out via the official PHM 2025 Forum or email the organizers.
Good luck and happy modeling!