PHM North America 2024 Conference Data Challenge
Objective
This year’s data challenge is on estimating the health of helicopter turbine engines. It is both a regression and classification problem. We also want to know how trustworthy the algorithm(s) are, so a measure of confidence will be reported for each of your predictions. Our intent is that the design of this confidence metric is as important as the prediction itself.
Problem
This year’s problem is to assess the health of helicopter turbine engines. The combined datasets has seven engines (assets) all of the same make and model. You will be given all of the measured data for four of the assets in the training dataset, but the observations have been shuffled and asset ids have been removed. The remaining three assets are used to form the test and validation datasets.
Note that your algorithms will have to generalize on assets on which they were not trained.
Each engine is instrumented to capture the outside air temperature, mean gas temperature, power available, indicated airspeed, net power, and compressor speed. For these operational conditions, there is a design (target) torque. The real output torque is also measured. Engine health is assessed by comparing the output torque to the design torque. More specifically, we look at the torque margin as an indicator of engine health:
torque margin (%) = 100 * (torque measured – torque target) / torque target
Thus it can be observed if an engine underperforming.
For each observation in the test and validation datasets, competing teams will predict the asset’s health by
- Estimating the binary classification of the health state (0 = nominal, 1 = faulty), and confidence metric (continuous variable 0 to 1).
- Estimating the torque margin expressed at a probability distribution function (PDF). Teams can select from a list of PDFs. This is probabilistic regression.
Participants will be able to submit model results for the testing data online and update as often as they want on a daily basis. The last submission from each team will be scored will be scored daily at midnight Pacific Daylight Time (7:00 am UTC). Scores will be updated on a leaderboard to provide participants their relative positions.
During the validation phase of the challenge, a validation dataset will be released for a one-time assessment. The validation phase will be two weeks before the data challenge final deadline. Scoring of the last results file submitted by a team will be done only one time at the final deadline. Final submission links will be made available once the final data is released.
A few top performing teams from the validation phase will be selected for final evaluation. They will be asked to submit a brief report explaining their approach. Selection of winners will not only depend on the final validation set score but also the novelty and soundness of approach. Further, these teams will be required to agree to present their approach at the PHM 2024 conference before final winners are selected. Top winning approaches will be invited to submit a manuscript to the International Journal of Prognostics and Health Management (IJPHM) and present their approach and results at the 2024 PHM Society Conference. Winning teams will be announced and recognized at the conference banquet.
Teams
Teams may comprise one or more team members, and collaboration is highly encouraged. At least one member of the finalist teams must register and attend the PHM 2024 Conference to present their approach and results in the special data-challenge session. Finalists may also submit an extended abstract to be included in conference proceedings. A full manuscript may be submitted to IJPHM for a journal publication after the conference.
The organizers of the competition reserve the right to both modify these rules or disqualify any team for efforts deemed inconsistent with fair and open practices.
Relavant Dates
| Date | Stage |
|---|---|
| June 17, 2024 | Competition Open |
| August 9, 2024 | Final validation data posted |
| August 18, 2024 (11:59:59 pm PDT) | Competition closed |
| August 21, 2024 | Finalists announced |
| September 20, 2024 | Initial conference papers due |
| November 1, 2024 | Final conference papers due (after peer review) |
| November 11 – 14, 2024 | PHM2024 Conference dates |
Training and Testing Datasets
The training and test datasets are available here:
Validation Dataset
The validation dataset is available here:
Data Challenge Submission
Please upload your submissions for both the testing and validation datasets in the Data Challenge submission area. Note that you will only see the submission area if you have previously applied using the application form and we have granted you access. You may upload or overwrite your submissions as often as you want. The system will automatically score the latest testing submission from each team every day at 3:00 am Pacific Daylight Time (10:00 am UTC). Validation submissions will only be scored once (after competition closes). Results will automatically be posted on the Leader Board (coming soon).
Please ensure the submission file uses the JSON format (due to limitations of the file upload plug in, please use the file extension “.jso” instead of the traditional “*.json”). Thus, the filename for testing dataset submissions is submission.jso and for validation dataset submissions is validation_submission.jso. Otherwise, the automated scorer will not read your file and score your algorithm, and the conference organizers will not consider your submission as a valid submission. Please ensure that your results are in the format shown in this example submission file. Note that sample indexing starts at 0.
For each prediction, you will submit the following;
– sample_id
– This is the key for each json entry
– classification
– key: “class”
– binary entry
– 0 = nominal, 1 = faulty
– classification confidence
– key: “class_conf”
– continuous variable ranging from 0 to 1
– 0 = no confidence, 1 = high confidence
– PDF type
– key: “pdf_type”
– string
– PDF variables
– key: “pdf_args”
– floats
An example submission is as follows:
{
"0": {
"class": 1,
"class_conf": 0.5,
"pdf_type": "norm",
"pdf_args": {
"loc": -1,
"scale": 0.1
}
},
"1": {
"class": 0,
"class_conf": 0.4,
"pdf_type": "cauchy",
"pdf_args": {
"loc": -0.1,
"scale": 1
}
},
"2": {
"class": 0,
"class_conf": 0.4,
"pdf_type": "gamma",
"pdf_args": {
"loc": -0.1,
"scale": 1,
"a": 0.5
}
}
}
Using PDF for probabalistic regression
The Python Scipy package is being used to evaluate the pdf. Specifically, we’re using the stats, continuous distribution functions. Each of these distributions has a pdf method that creates a pdf that can be used to score your answer (more on that below). You can select any PDF listed below. When submitting the pdf, use the notation and include the positional arguments as a list.
| Stats model | Nomenclature |
|---|---|
| Normal | norm |
| Exponential | expon |
| Uniform | uniform |
| Gamma | gamma |
| Beta | beta |
| Log-Normal | lognorm |
| Chi-Squared | chi2 |
| Weibull | weibull_min |
| Student’s t | t |
| F | f |
| Cauchy | cauchy |
| Laplace | laplace |
| Rayleigh | rayleigh |
| Pareto | pareto |
| Gumbel | gumbel_r |
| Logistic | logistic |
| Erlang | erlang |
| Power Law | powerlaw |
| Nakagami | nakagami |
| Beta Prime | betaprime |
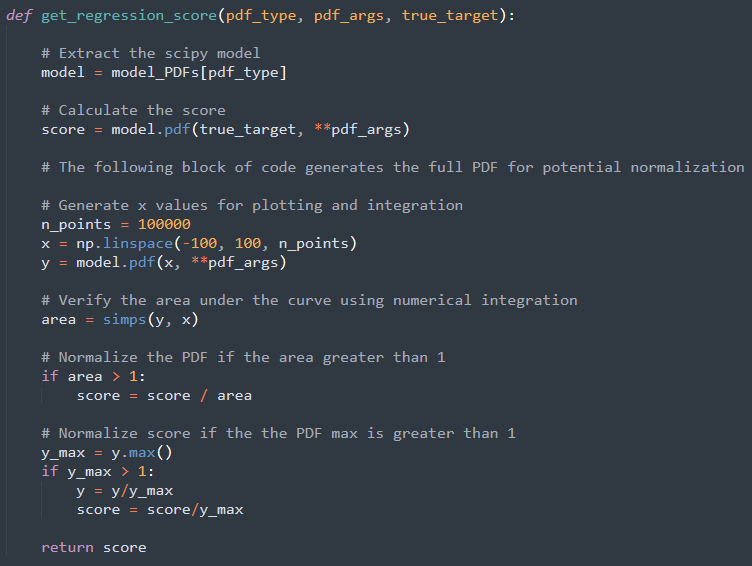
All distributions will be normalized to ensure that the area under the curve is 1 and that the probability of any given value is less than or equal to 1. Other distributions found in Scipy can be used upon request.
Scoring
One aim of this competition is to measure confidence about the submitted classification and regression. As such, the confidence level is a factor in the scoring system. Classification and regression predictions will be scored separately, and the final score is the mean score of all predictions.
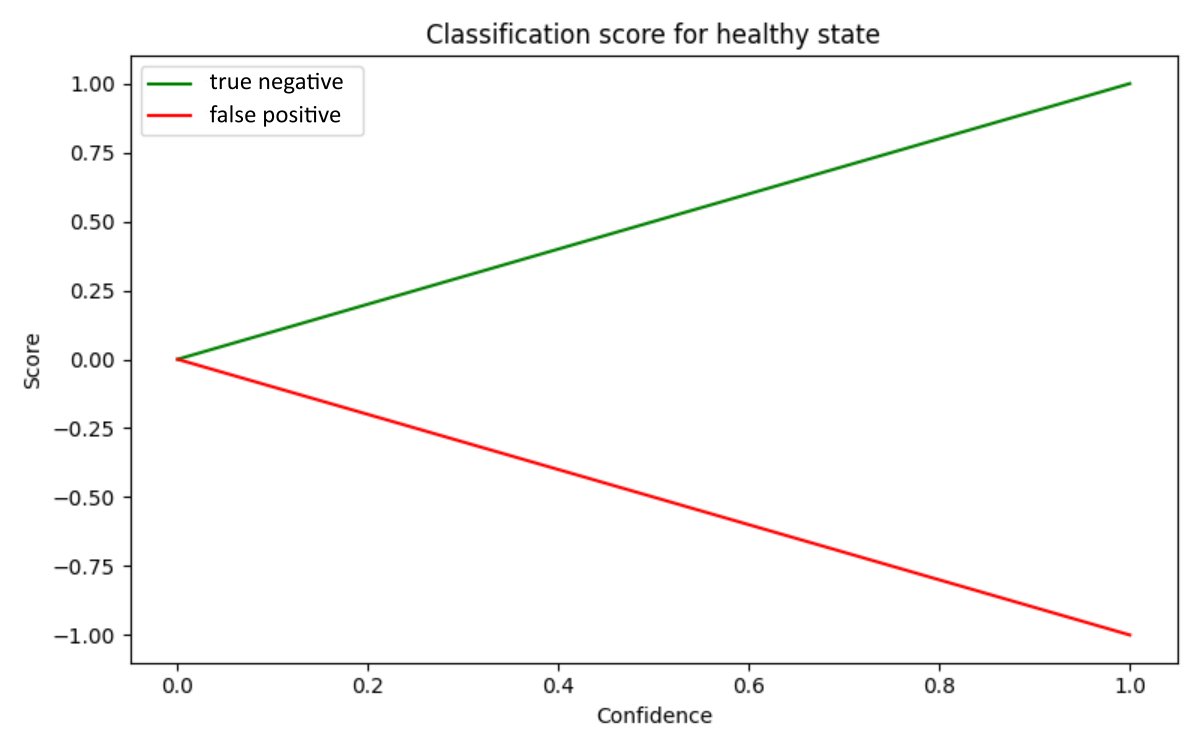
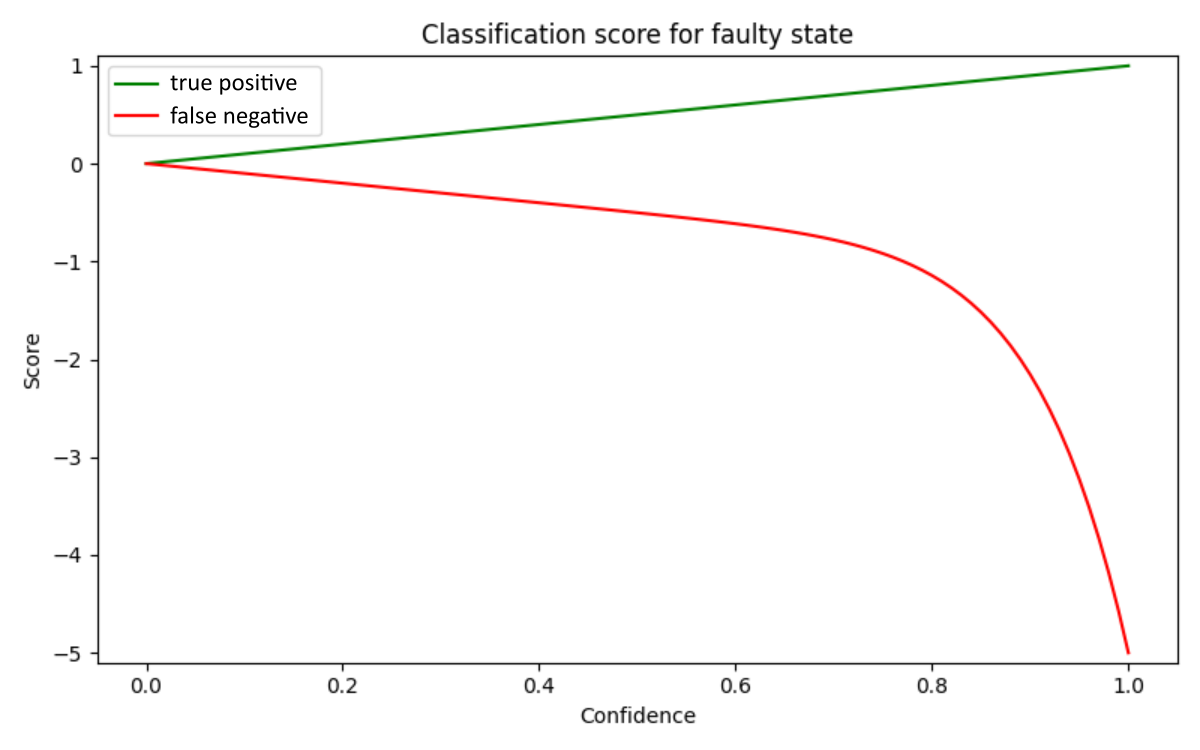
Classifiation score
Classification scores will be linearly weighted for correct answers and false positives but strongly penalized for highly confident false negatives. As a reminder, a false negative is predicting that the engine is healthy when, in fact, it’s faulty. A false negative prediction can lead to expensive repairs and, in the worst case, be deadly.
Scoring function
# check confidence to make sure it's between 0 and 1
if (confidence < 0) or (confidence > 1):
score = -100
return score

# make sure that the pred_label is 1 or 0
if pred_label != 0:
if pred_label != 1:
score = -100
return score

# invert confidence is pred_label is incorrect
if pred_label != true_label:
confidence = - confidence

# true state is healthy
if true_label == 0:
score = confidence

# true state is faulty
else:
if confidence >= 0:
score = confidence
else:
score = 4 * confidence **11 + 1.0 * confidence
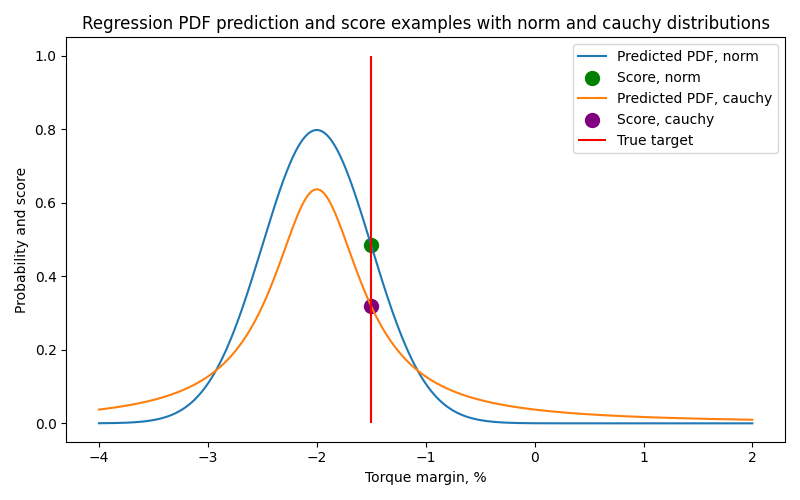
Regression score
Regression scores are calculated by the intercept of the true value with the predicted PDF. The image below shows an example of predictions using a Normal (norm) and Cauchy (cauchy) PDFs.