PHM North America 2026 Conference Data Challenge
The Prognostics and Health Monitoring (PHM) Data Challenge 2026 focuses on estimating gear tooth damage states using inexpensive sensor measurements, with periodic imaging data available only during training.
Background and Motivation
Mechanical component failures—such as wear-induced surface crack formation and fatigue crack propagation—show significant variability across samples. This variability is reflected as large statistical variance in reliability analyses.
To support actionable decision-making—such as remaining useful life (RUL) estimation, condition-based monitoring (CBM), and prognostic health management (PHM)—models must account for this variability.
Spall Damage Estimation Goal
Spall damage in gear teeth is a progressive failure process in which damage initiates and evolves independently across individual teeth. Periodic imaging provides the most reliable direct assessment of damage state, but it is costly and operationally disruptive.
This challenge aims to develop models that continuously estimate gear damage using only inexpensive sensor measurements, while using imaging data only during training. The organizer maintains an undisclosed ground truth damage assessment. Model performance is evaluated based on how well predictions match this reference.
Illustrative Example (not part of the data challenge)
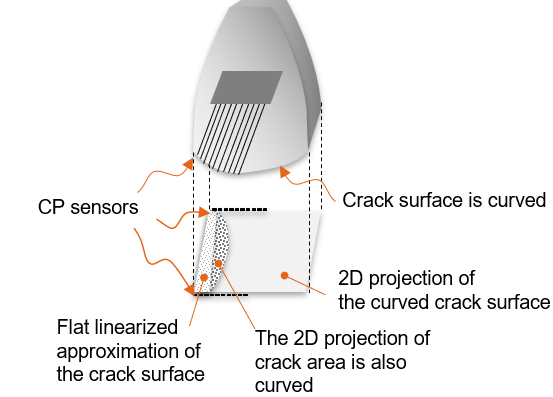
To illustrate variability, Figure 1a summarizes the number of cycles associated with fatigue crack propagation in spur gear teeth. Figure 1b shows an example crack and its corresponding diagram, and Figure 1c shows the fatigue tester used to generate the data under sinusoidal loading.
The number of cycles (N) is shown on a logarithmic scale. Data are grouped by load and displayed in separate subplots. Load levels—defined as vertical forces at the high point single tooth contact (F_{HPSTC})—are indicated along the y-axis.
Load dependence is generally weak except at higher loads, while microstructural variability plays a dominant role, resulting in wide distributions.
These data are not part of the challenge dataset; they are included only to illustrate variability.
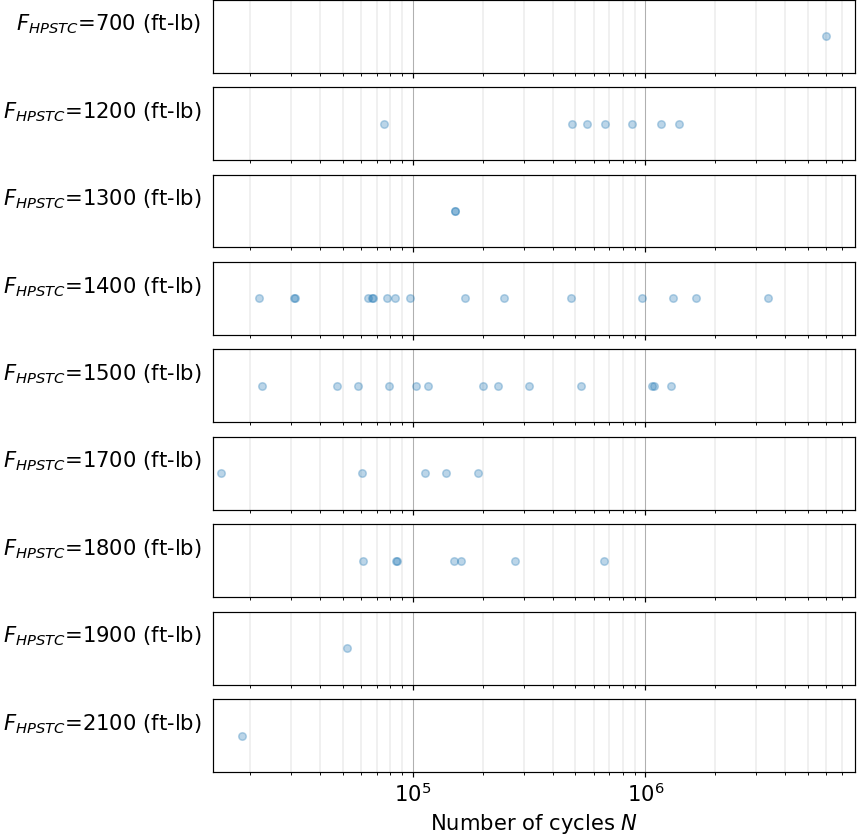
Figure 1a. Distribution of number of cycles for spur gear cracks. |

Figure 1b. Example crack and associated diagram. |
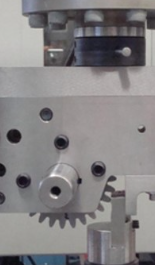
Figure 1c. Fatigue tester used for crack propagation. |
Technical Overview
Problem Focus
This problem focuses on modeling surface damage progression—from wear to micro-pitting, pitting, and ultimately spall formation.
The objective is to estimate damage progression using vibration data, with ground truth derived from close-up images of gear surfaces. Figure 2 shows the image acquisition process.
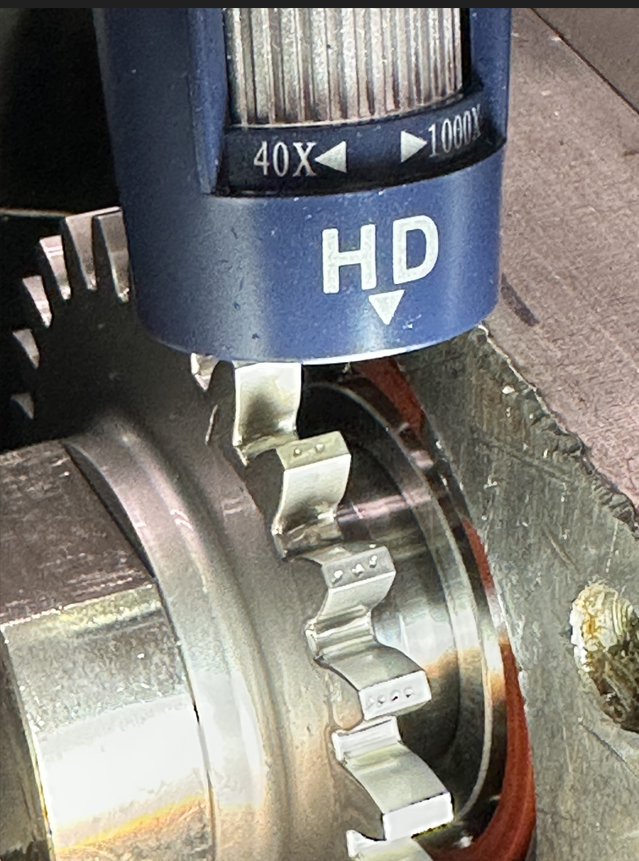
Figure 2. Capturing images of gear surfaces after a run.
Experimental Setup
Seven accelerated life experiments (A–G) are provided. In each experiment, a spur gear with 28 teeth is operated until failure.
The experiments are conducted using a simple gearbox (Figure 3a) with a one-to-one gear ratio.
Failure is defined when the gear becomes unusable, with lifespans ranging from approximately 30 to 90 hours. Each experiment consists of multiple runs. The duration of most runs is approximately 6 hours, with a few exceptions ranging from 1 to 3 hours. The duration of each run can be determined based on the size of the data.
This variability in lifespan is inherent to the system. Sensor measurements should therefore be interpreted as indicators of damage severity, not as proxies for elapsed time.
Vibration data are collected using two accelerometers:
- One mounted in the axial direction (Figure 3b)
- One mounted in the radial direction (Figure 3c)
The radial accelerometer is more sensitive, and classical vibration indicators derived from this sensor are included in the dataset.
Tooth surface images are captured after each run to provide ground truth for training.
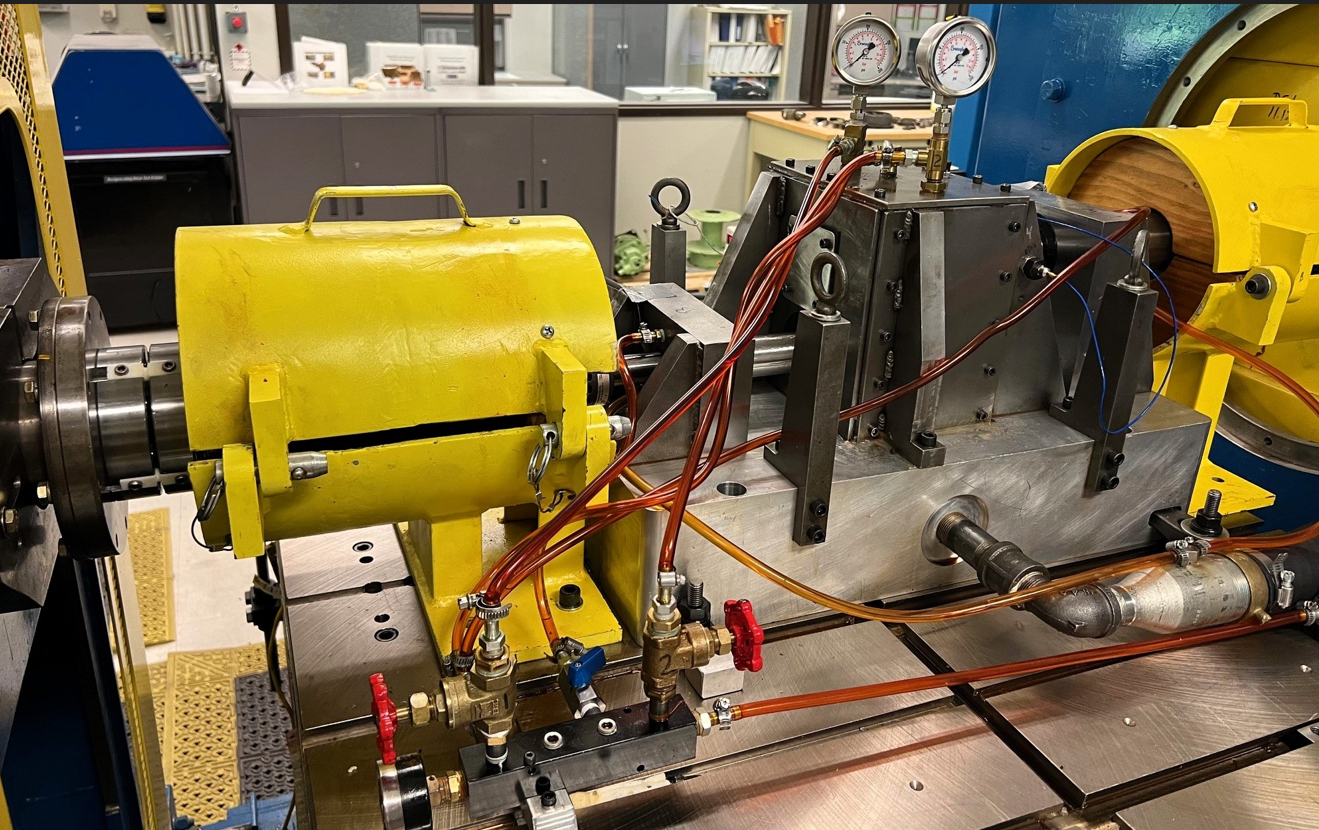
Figure 3a. Gearbox. |
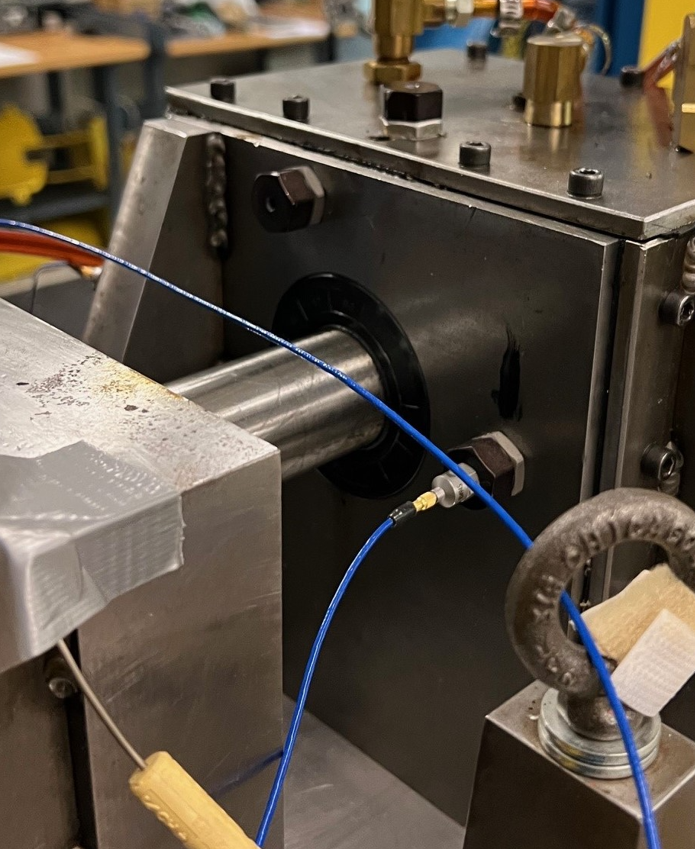
Figure 3b. Axially-mounted accelerometer. |
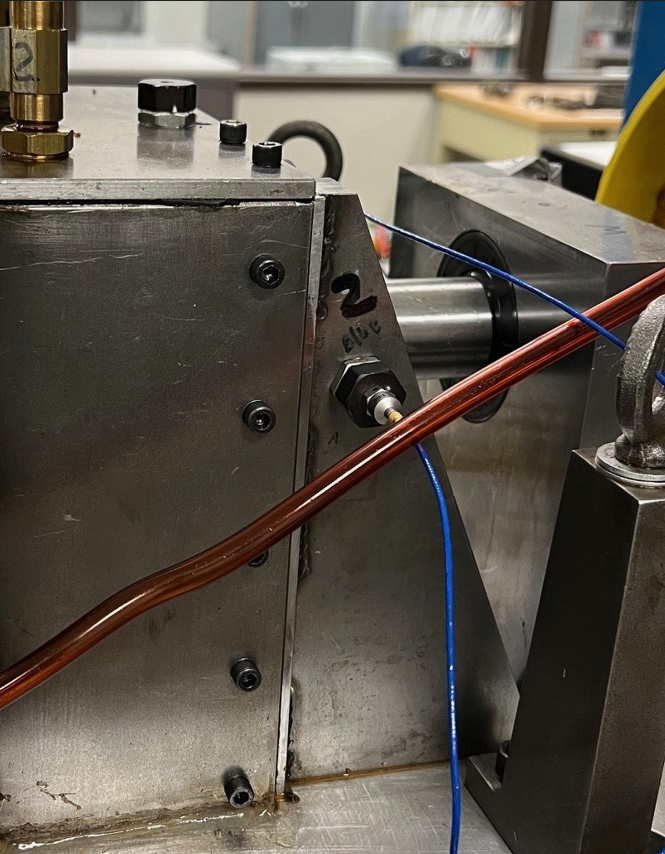
Figure 3c. Radially-mounted accelerometer. |
Sensor Measurements
Raw vibration data and TSA (time synchronous averaging) data may be used at the participants’ discretion. Non-vibration channels serve as the baseline input set (CIs + context variables, etc.).
Data Format
Vibration data are stored in HDF5 format, with each file corresponding to one minute of operation. The original signals were recorded in LabVIEW TDMS format and subsequently converted to HDF5.
The dataset includes the following channels:
- Context variables, such as torque, speed, and temperature (sampled at 1 Hz)
- Vibration signals, including accel 1, accel 2, and encoder data (sampled at 102.4 kHz)
- Condition Indicators (CIs), including classical vibration-based metrics such as FM4, NA4, M6a, and ALR, are computed for 1-second segments without overlap.
- Transforms, such as time synchronous averaging, residual, and difference signals used to compute CIs
- In-line oil sensor data (DM450 and ICM2), which may be ignored
Dataset Structure
| Set | Number of Experiments | Sensor Data | Tooth Images |
|---|---|---|---|
| Training | 3 | Full | Yes, all 28 teeth at 6-hour intervals |
| Test | 2 | Full | No |
| Validation | 2 | Full | No |
No organizer-provided ground truth is included in any dataset.
The Challenge
Participants must solve two coupled sub-problems during training and apply the results to test and validation experiments.
Sub-problem 1: Damage Label Derivation (training only)
Using the tooth images provided for training experiments, participants must derive a scalar damage value after each run (at ~6-hour interval or shorter) for each experiment.
This involves:
- Estimating spall size or severity for each of the 28 teeth using any image analysis method
- Aggregating these per-tooth values into a single scalar damage value using any chosen method (e.g., max, mean, weighted sum)
This produces a self-defined damage trajectory for each training experiment, which serves as the training target.
Sub-problem 2: Sensor-to-Damage Mapping
Using sensor data and the derived damage trajectories, participants must train a model that maps sensor measurements to scalar damage estimates at each 6-hour interval.
Test Phase
For test experiments, only sensor data are provided. Participants must generate predicted damage trajectories (one scalar value per 6-hour interval).
Feedback is provided once every 24 hours to support model tuning.
Validation Phase
For validation experiments, participants must submit final predicted damage trajectories using only sensor data.
These predictions are used for final evaluation.
Prediction Output Format
For each validation experiment, participants must submit a time series of scalar damage estimates, with one value per measurement interval (typically, but not always, six hours).
The number of predictions depends on the duration of the experiment.
Submission Requirement
For each experiment:
- Submit N scalar values, where N approximatly equals the number of 6-hour intervals
No additional fields are required.
Evaluation
The organizer computes a ground truth damage trajectory using a fixed, undisclosed method. This ground truth is not shared with participants.
Predictions are evaluated against this reference.
Important Consideration
Since participants define their own damage metrics, predictions may be rescaled using an optimal monotonic transformation before evaluation. This ensures fairness by focusing on trajectory shape rather than absolute scale.
Scoring Metric
- Mean Squared Error (MSE) between predicted and ground truth trajectories
Schedule
| Date | Milestone |
|---|---|
| May 1 | Soft launch (training data only) |
| June 1 | Test data release |
| July 24 | Validation data release |
| August 7 | Competition ends |
| August 12 | Preliminary results announced |
| September 4 | Manuscripts due (contestants must write and present a paper to be eligible to win) |
| September 26 | Conference begins |
| September 28 | Data challenge presentations (tentative) |
Data Download
Training data are available at:
https://gtc-data.synology.me:51111/sharing/uIrAvzqEh
Download Training Data
Test data are available at:
https://gtc-data.synology.me:51111/sharing/3LlAuvblO
Password: 4phm2026DataChallenge_test
Download Test Data
Validation data will be released according to the schedule.
Submissions and Daily Scoring
Teams may submit results as often as they want. An automated scoring routine will score the latest submission from each team every night. Teams must first apply and be approved before submissions will be accepted.
A sample submission form is included in the test repository, named “example_submission.csv”. You only have to change the values in the “metric” column. Please rename the file to “submission.csv” before you upload it.
PHM 2026 Data Challenge Application Form
PHM 2026 Data Challenge Submission Area
Key Assumptions and Constraints
- Ground truth is not provided for any dataset
- Images are only available for training data
- Experiment duration varies (30–90 hours), and time should not be used as a proxy for damage
- Duration of an experiment the duration of an experiment in the test and validation data may be wildly out of sample from the training data
- Predictions must follow a fixed 6-hour interval cadence
Disclaimer
The Organizing Team maintains sole and absolute discretion over all aspects of the challenge. This includes, but is not limited to, the right to modify competition rules, timelines, and eligibility requirements at any time and without prior notice. The Organizing Team reserves the right to disqualify any participant or team for any reason – including actions deemed detrimental to the integrity of the competition – without obligation to provide justification. All decisions are final, binding, and not subject to appeal.